Accelerate hardware testing
- Run more experiments in your test facility window
- Get live alerts and instant insights at the testbed
- Catch critical failures before disassembly
Universal Data Format Support
Import telemetry from virtually any engineering data source without manual cleanup or script rewrites.
CCSDS
.ccsds
TDMS
.tdms
MDF4
.mf4
HDF5
.h5
CSV
.csv
Parquet
.parquet
Binary
.bin
XTCE
.xtce
JSON
.json
Interactive Playback
Replay recorded telemetry exactly as it happened with nanosecond timestamp sync.
Event Markers
Automatic incident & anomaly flags.
Multi-stream Synchronization
Align 250+ DAQ channels on one clock.
Variable Speed
Slow-motion to 50x fast forward.
Timeline Scrubbing
Jump to anomaly timecodes instantly.
Frame-by-frame Playback
Inspect microsecond transient glitches.
Telemetry Playback
Frame-accurate stream playback control.
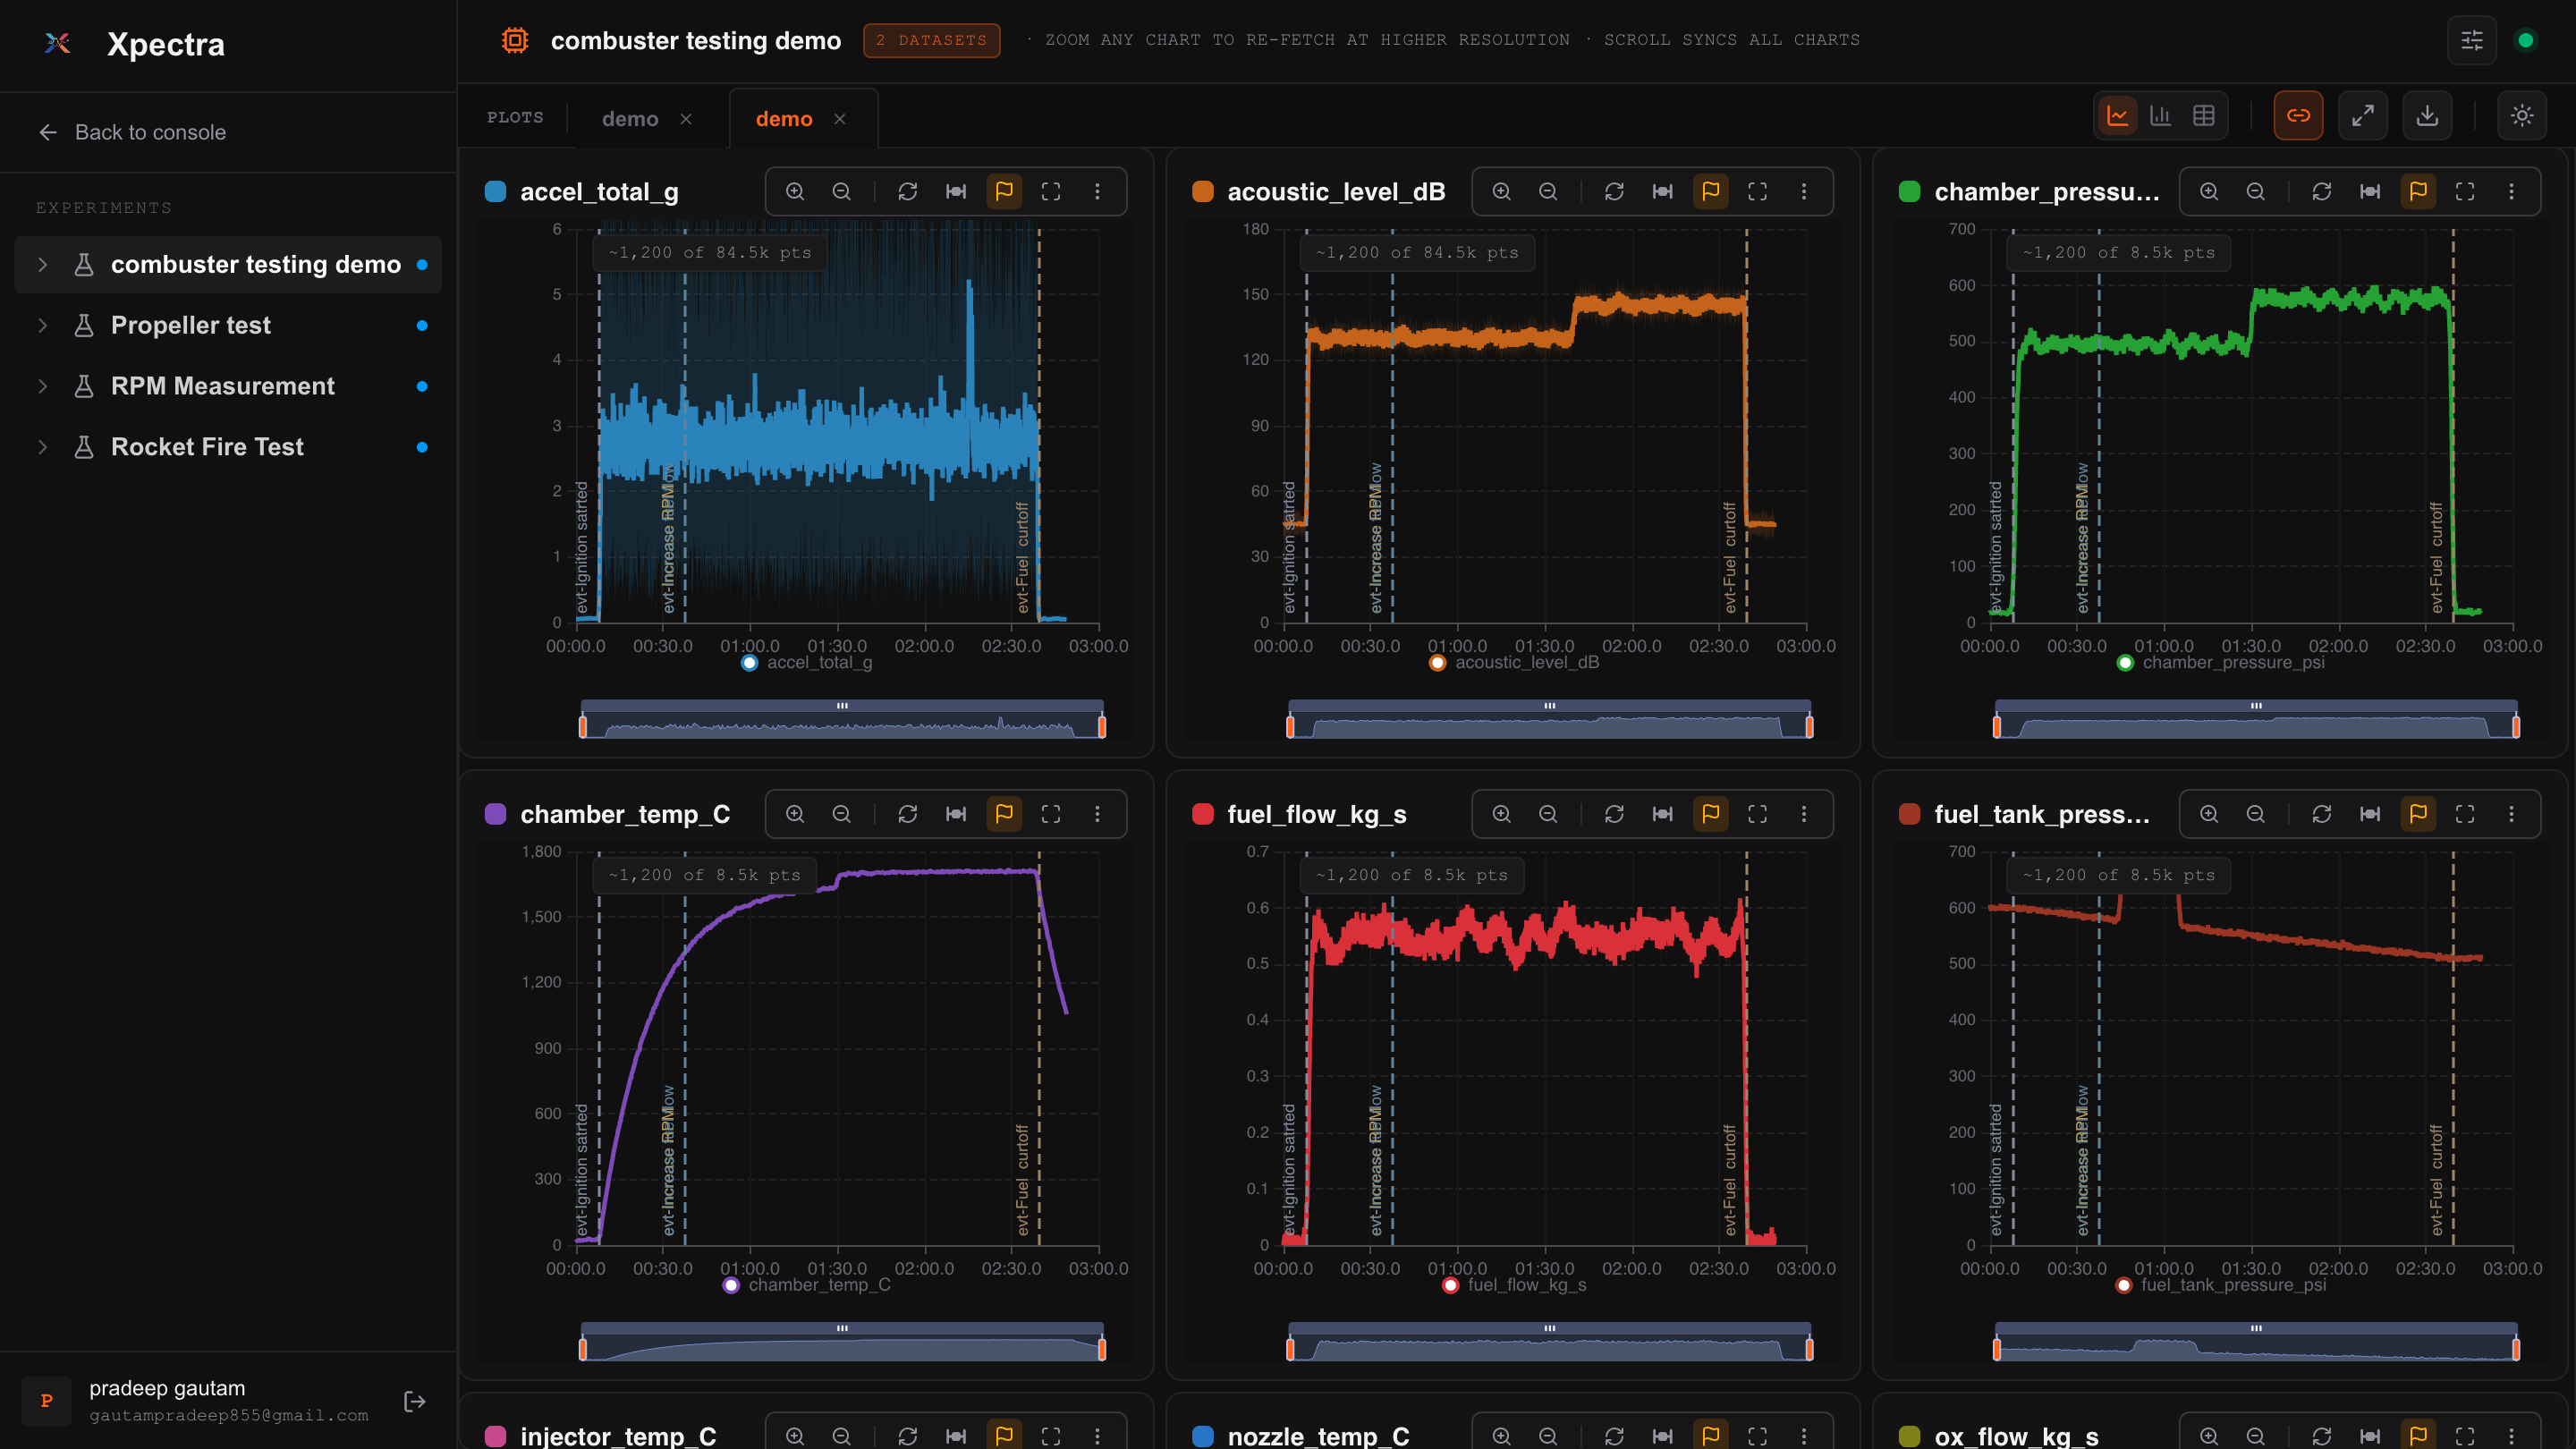
Data Playground
Explore telemetry without writing complex data processing pipelines.
AI Assisted Analysis
Natural language query & anomaly flags.
Signal Plotting
Multi-channel zoom-linked browser charts.
Compare Channels
Overlay test campaign signals side-by-side.
SQL Query
Execute ANSI SQL directly on time-series.
Python Notebook
Integrated Pandas & Polars Jupyter kernels.
Export Results
One-click export to Parquet, CSV, or Arrow.
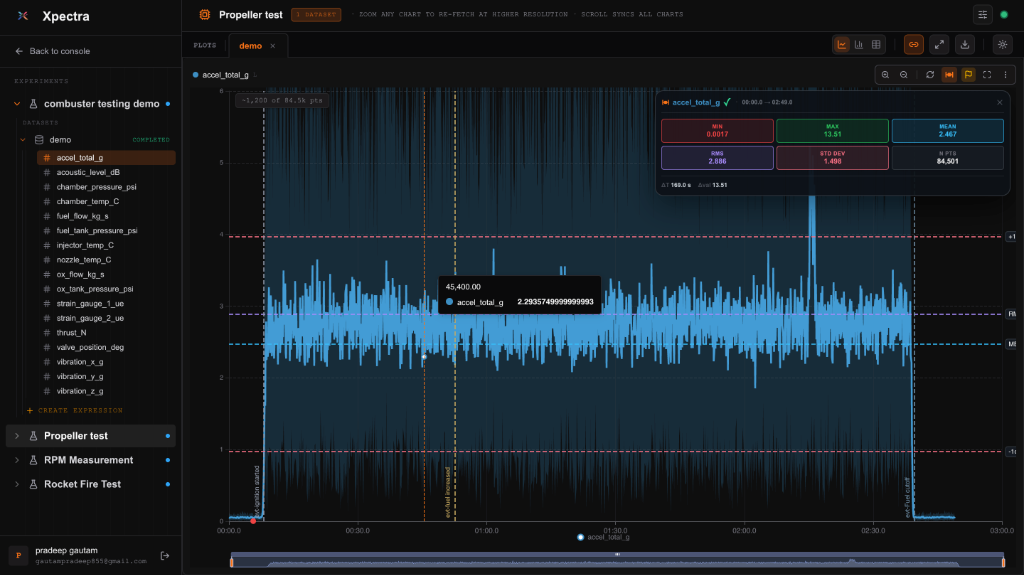
Superfast Statistics Engine
Built for millions of telemetry samples with sub-second aggregate computation.
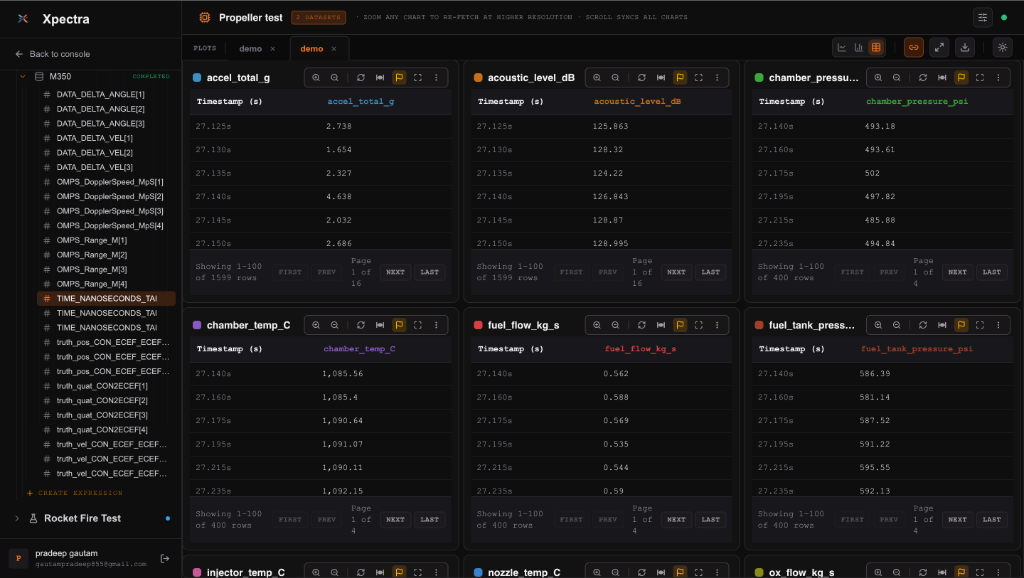
Real-Time Streaming
Process live telemetry streams with ultra-low latency and zero packet loss.
High Availability
Multi-region failover & zero data loss.
Low Latency
Sub-millisecond ingestion to storage pipeline.
Live Processing
Ingest 500k+ msg/sec per cluster node.
Auto Buffering
Zero-loss ring buffer against backpressure.
Stream Validation
Enforce schemas & resequence out-of-order logs.
Event Triggering
Real-time webhooks on threshold breach.
Client Engine
High-performance local processing engine running directly in your browser or edge hardware for zero-latency telemetry manipulation and offline evaluation.
Local WASM Processing
Execute sub-millisecond filter & FFT math client-side.
Zero Network Latency
Instant chart rendering & local formula evaluation.
Offline Cache & Sync
Buffer test telemetry locally & auto-sync when online.
Multi-Threaded Workers
Parallel Web Workers for smooth 120 FPS signal plotting.
Native Edge Bindings
C++, Rust, and Python SDKs for embedded DAQ hardware.
Air-Gapped Security
Keep sensitive telemetry enclosed inside local client memory.
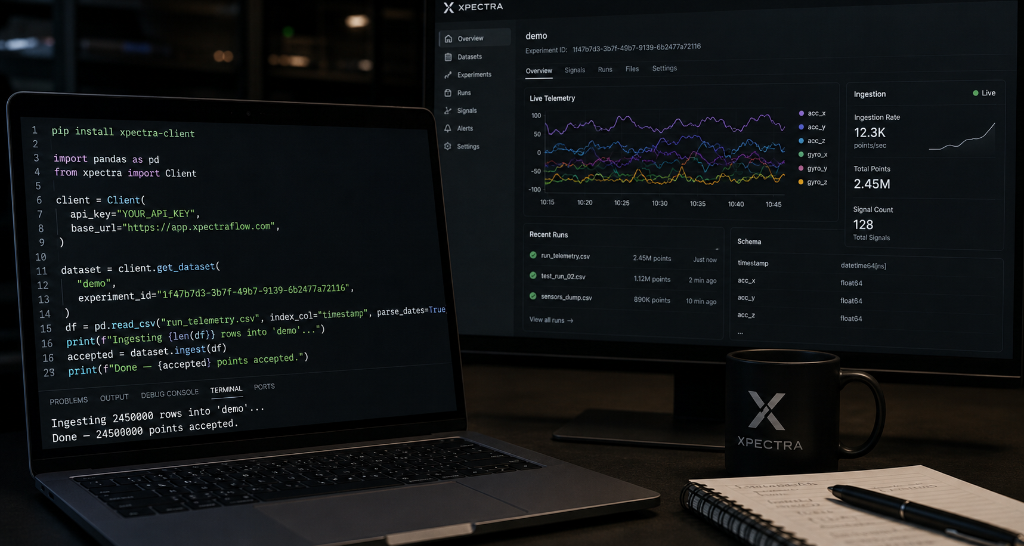
Ready to modernize your telemetry stack?
Deploy Xpectra in your environment with a 30-day enterprise evaluation.